Friday, June 7, 2019

Bramor Mission

Introduction

Fixed wing flight has always been preferred when covering large areas compared to using a quadcopter or multirotor system.  In this mission we use the Bramor fixed wing to collect data.  This platform is completely autonomous which means that the importance of the checklist prior to flight is key.

Study Area

We flew our mission at Purdue Wildlife Area on 06/03/19.  The weather was 79 degrees Fahrenheit with little to no wind.  The platform used was the Bramor set to fly at 120 meters with a speed of 16 meters a second.  There were no GCPs set up for this flight due to the use of PPK (post-processing kinetics).

Methods

The importance of the checklist is always stressed when dealing with such expensive machines.  The flight crew was constantly looking over the checklist even prior to leaving for Purdue Wildlife Area.  This is important to do to make sure you do not leave any materials behind at lab.  At the field we set up the catapult so that we could avoid any tailwinds.  This is because we need to ensure that we can clear any obstacles and a tailwind has the possibility to screw that up.  Below you can see what the Bramor look like in its case and on the catapult.


Discussion

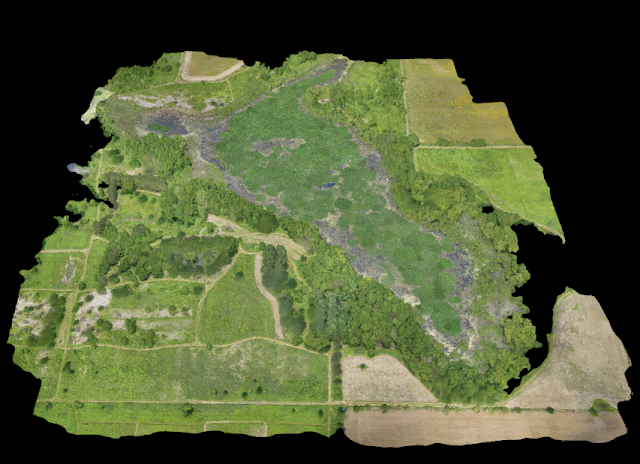
The entire Bramor flight went on without any problems.  One of the biggest worries was the takeoff portion including the catapult.  Following the checklist very closely though has benefited our crew so that no problems arose.  During the actual flight, flight crews were stationed around the area to give regular updates to the active flight crew who launched the fixed wing.  Below you can see the completed orthomosaic for the Bramor flight.


Conclusion

So many things can go wrong with autonomous flight which is why the use of checklists is so extremely stressed.  With autonomous flight, we need failsafes in case the fixed wing goes haywire.  Thanks to strong resource management, the Bramor flight had zero problems during the mission.


Thursday, June 6, 2019

Volumetrics in ArcMap

Introduction

Applications of volumetrics can be seen throughout the world.  An example of using volumetrics can be seen in measuring volumes in mounds and in buildings. With UAS platforms, using volumetrics can cut down time and improve accuracy.  In order to gather this data one must have the bulk density from the mound. 

Methods

In our lab, we were assigned with using ArcMap to figure out the volumes of different mounds from their DSMs.  The first example is from the Wolfcreek data set.  First we must choose a mound to work with, then we have to clip it to differentiate from the whole DSM.  Below is an image of the first step of making a clip of the mound.
To do this one must use the editor tool to trace out the desired area.  It is recommended to get as close as possible to the mound for taking measurements.  Having the line closer in is preferred because it will make the data more accurate rather if the line is farther away and including more ground.  

The next step we took was to extract by mask with the mound clip.  To do this we used the extract by mask tool and used the original DSM as the input raster.  Below is the clip with the DSM limited to that specific clip that helps us get the volumetrics.  
Once we have the clips extracted, we can perform a surface volume analysis.  This will allow to read the measurements for the separate mounds.  Below is how the data is found for each mound.

The tables show the lowest elevation of the mound called plane height and the volume of the mound.  The first mound had a volume of 506.45m^3, second was 2,339.44m^3, and the third was 223,472.97m^3.  

Discussion

Another interesting feature in ArcMap is the feature to Cutfill across two DSMs.  This analyzes the changes between the images and elevation.  Below are the before and after images from the Litchfield Mine data.  The before image was made on July 22 and the after was on September 30.

Above is on July 22
Below is on Sept 30


In order to perform the Cutfill function, we first had to resample the DSM.  This is because Cutfill with millimeter accuracy would take too long and is not necessarily require that much detail.  To streamline the process we resampled the data to ten centimeters.  Below is the Cutfill function result.  The red represents the net gain and the blue represents the net loss.  There is also a color for unchanged but for this the elevation must change by absolutely nothing in order to show.

Conclusion

Using UAS for volumetrics has proved to make the whole process much more efficient.  The data has been incredibly accurate and has put some ground crews to shame.  It is important to note that to use the Cutfill function, you must have very precise data in order to have a successful Cutfill.  Having GCPs will greatly improve your results.  They should be placed around the same locations for different times to have better results.  Knowing this allows us to realize that this process is not always fully accurate but can help mitigate any outside altercations.


Tuesday, June 4, 2019

Open Source GIS and Volumetrics

Today our class learned about open source GIS and volumetrics from Christina Hupy.  She has a background in academia and the GIS industry.  She has taught GIS in Wisconsin for 11 years and decided to take the opportunity to speak with our class about the GIS world of open source.


Above is a Litchfield image processed from an open source platform.  The free open source program used to process this image was Open Drone Map.  This program is incredibly useful for people who cannot afford the enterprise programs that cost thousands of dollars.

Volumetrics

Within Open Map Drone, one is able to calculate volume of certain objects within the orthomosaic.  This is made possible because the program creates a DSM along with the orthomosaic.  The DSM contains the different elevations within the image.  In combination with the program also getting the horizontal measurements, the program can calculate the volume of objects.  For example we can calculate the volume of a mound within the orthomosaic.  The images below show the process for calculating the volume.

First we must outline the pile that we prefer in order to pinpoint exactly what we want calculated.  If there were any objects above the mound we desire to measure we can simply delete the points in the point cloud for anything above the mound.  Once deleted, the mound will automatically fill the void area to finish the mound.

We then make sure to include a DSM  of the selected area to ensure we are calculating the right elevations.

After the area is selected, the processing tab at the bottom of the program will automatically calculate the volume.  For my area chosen the volume was 305.82m^3.

Having open source software is incredibly useful due to the fact that the public is constantly giving patches to help improve the program.


Sunday, June 2, 2019

Field Notes Three

Observing Tornado Aftermath

Introduction

Natural disasters are happening all across the country and UAS applications have been used in order to analyze the aftermath.  We are currently in the peak season for tornados to occur.  In this lab we drove out to a Purdue barn that was recently torn apart by a tornado.  We used the unfortunate circumstances as an opportunity to map out the barn remnants to find out the path taken by the tornado.

Study Area

As mentioned earlier, we drove to a barn located north of Purdue Agriculture fields.  We used two different platforms to collect data.  One being the Mavic 2 Pro and the other being the H520.  Flight characteristics are an altitude of 61m while flying with the camera angled nadir.  The flight took place on 05/29/19 during the time of 11:10 am to 12:30 pm.   The weather being partly cloudy accompanied with calm winds had a temperature of 70 degrees Fahrenheit.  

Methods

This mission did not include any Propeller aeropoint GCPs.  We began with flying the Mavic in video mode.  This was intended to get a view of the area that we going to be surveying.  After we recorded a video of the line of barn debris, we put the camera angle to nadir and manually took photos along the line of debris.  The H520 was then used with a programmed mission in order to take photos of the debris.  These flights both took approximately 20 mins.  After mapping the line of debris, the H520 had a mission planned to map the area around the barn's foundation.  This flight had to be cut short due to the construction crew coming back from their lunch break.

Discussion

Below is an image of the overlap of the processed images from the Mavic 2 Pro platform.
As you can see from the image, there is a large lack in overlap of the field.  This could be attributed to the fact that the Mavic flight was the only one to be performed in manual flight.  Manual flight is difficult to get proper overlay and consistent flight paths to get a solid orthomosaic.

Above is the completed mosaic by the Mavic.  As you can see, the completed product does not look very professional and the detail of the debris is not worth showing due to its lack in quality.

Below is an image of the orthomosaic taken by the H520 with the E-90 sensor.


Unlike the Mavic flight, this mission was planned in the H520 transmitter prior to flight.  The mosaic turned out great and had quality details of the debris spread over the field.  The H520 did an excellent job of getting overlapping images due to the large flight plan.  This type of data collection is preferred over manual flight because it is able to cover larger areas more accurately.

Conclusion

Analyzing results from natural disasters with UAS applications has emerged over the years proving incredibly useful data.  Using a UAS for this is safer and easier.  With our mission, we were able to determine the general flight path from the tornado and where the debris landed throughout the field.  An important takeaway from this mission is that planned missions are almost always preferred over manual missions as seen with the comparison between the Mavic and H520 flights.